A Tour of the Interface
Learn the purpose of each major area in the Nomosis Viewer and where to begin common tasks.
The Nomosis Viewer keeps the molecular scene in the center and places controls around it according to scope. Controls on the left organize what is loaded, controls on the right change or analyze the active structure, and controls at the top apply to the current workflow.
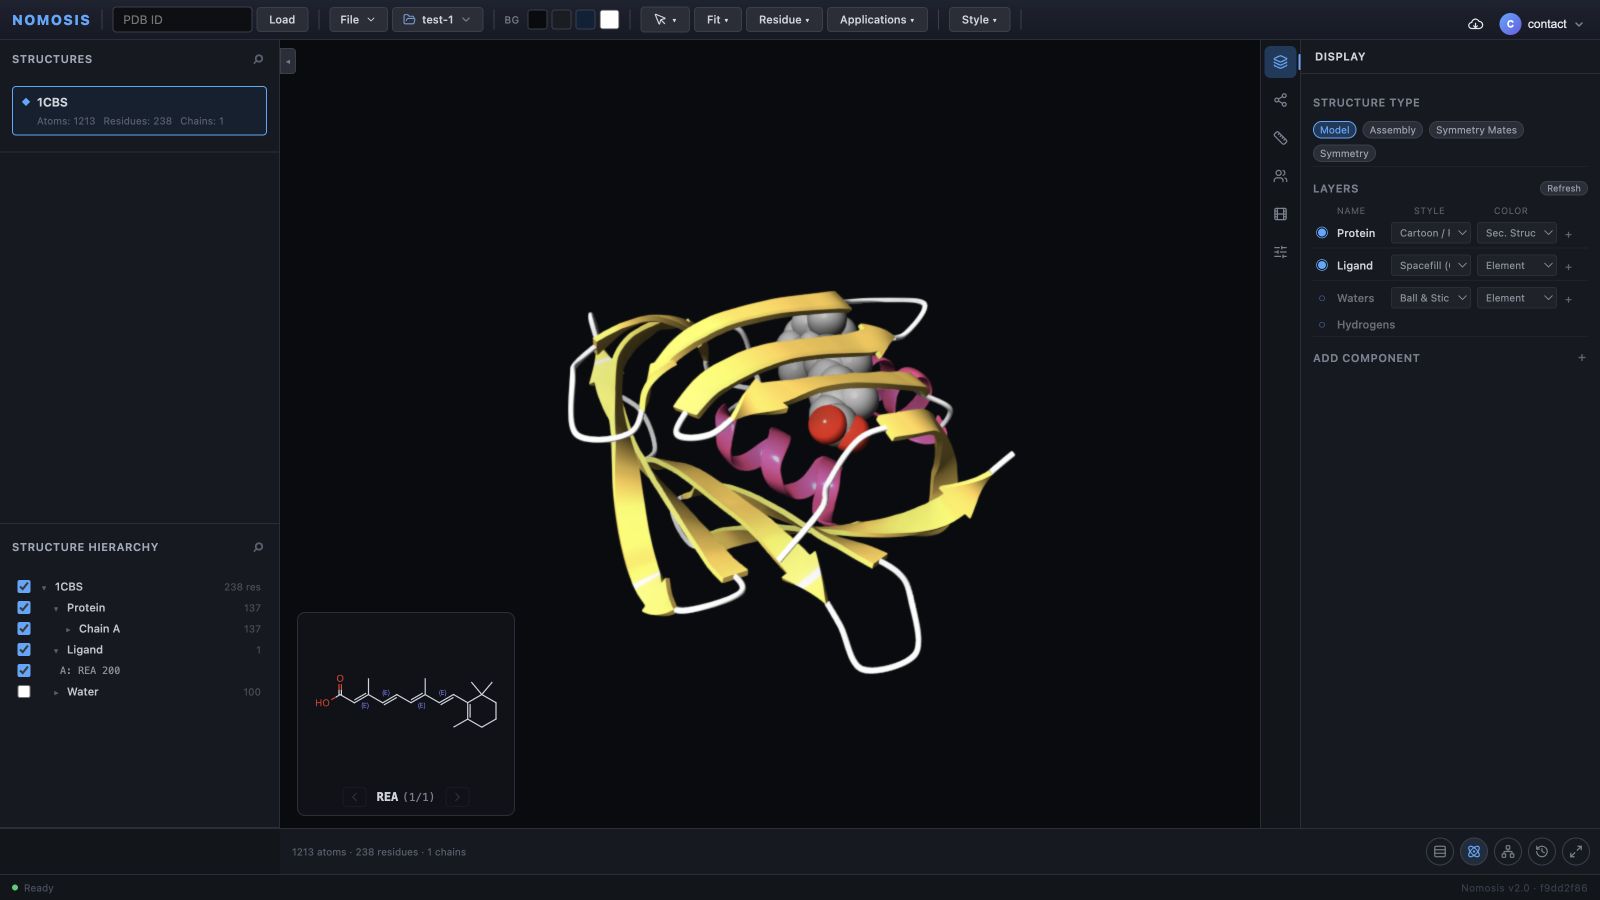
The Viewer on a standard desktop screen with 1CBS active. Read the workspace from left to
right: loaded data, the molecular scene, then display and analysis controls.
If you are not sure where to begin
Confirm the project at the top, select the intended structure on the left, choose Fit → All (reset), and then open Display on the right. Those four actions recover a predictable working state in most workflows.
Interface map
| Area | Purpose | Use it when you want to |
|---|---|---|
| Top bar | Global loading, project, camera, selection, application, and style controls | Open data, verify the project, fit the scene, or start an analysis workflow |
| Structures (left) | List of every loaded structure | Activate, rename, duplicate, pin, lock, export, or remove a structure |
| Structure Hierarchy (left) | Structure → category → chain → residue tree | Find and show or hide a precise part of the active structure |
| 3D viewport (center) | Interactive molecular scene | Rotate, zoom, pan, select, inspect, and open contextual actions |
| Tool sidebar (right) | Display and analysis panels | Style components, inspect interactions, measure, collaborate, export, or change settings |
| Viewport tabs and utilities (bottom) | Contextual views and persistent utilities | Open sequence, ligand, history, or full-screen views |
| Trajectory bar (bottom, when available) | Molecular-dynamics playback | Play, pause, scrub, and change playback speed |
Top bar
Read the top bar from left to right:
- PDB ID and Load open a public structure directly by identifier.
- File opens structures, trajectories, library items, exports, and saved viewer sessions.
- The project selector shows the active project. Check it before opening or saving project work.
- BG changes the viewport background without changing component colors.
- The picking-mode control switches between point selection and rectangle selection.
- Fit frames the complete structure or focuses the detected ligand.
- The granularity selector determines whether a click targets an atom, residue, chain, or entity.
- Applications opens higher-level workflows such as docking, MD analysis, ligand analysis, annotations, capsules, and stories. Context-dependent entries remain unavailable until compatible data is active.
- Style applies a coordinated visual preset to the scene.
Structures and hierarchy on the left
Structures
Each loaded structure has its own independent display and analysis state. Click a row to make that structure active. Right-click the row for actions such as Duplicate, Rename, Delete, Export mmCIF, Pin, and Lock.
- Pin keeps important structures at the top of the list.
- Lock protects a structure from accidental changes during a review.
- Rename gives the loaded item a clearer working label without changing the source file.
Structure Hierarchy
Expand the active structure to navigate through protein, ligand, water, ion, chains, and residues. Use hierarchy visibility controls when you need to isolate a chain or remove distracting solvent without deleting data.
The 3D viewport
The viewport is the main scientific workspace.
| Goal | Control |
|---|---|
| Rotate | Left-drag |
| Zoom | Scroll |
| Pan | Middle-drag |
| Select | Click |
| Add or remove from the selection | Ctrl/Cmd+click |
| Focus an atom | Double-click |
| Open contextual actions | Right-click |
| Recover a lost view | Fit → All (reset) |
The current picking granularity changes what a click means. Use Residue for most binding-site inspection, Atom for measurement endpoints, and Chain for larger structural comparisons.
Tools on the right
The vertical icon bar opens one panel at a time:
| Tool | What it controls |
|---|---|
| Display | Protein style, component visibility, representations, colors, hydrogens, selections, and quick interactions |
| Interactions | Interaction scope, types, appearance, and related controls |
| Trajectory | Trajectory-specific options; visible only when the active structure has a trajectory |
| Measurements | Distance, angle, dihedral, and label workflows |
| Session | Real-time collaborative viewing sessions |
| Studio | High-resolution image and video export |
| Settings | Background, lighting, effects, camera, and rendering quality |
| Docking | Docking-specific analysis; visible when a docking result is loaded |
If a panel hides too much of the scene, click its active icon again to collapse it.
Bottom utilities
The bottom edge contains compact entry points for views that support the 3D scene:
- Sequence Bar connects sequence positions with the active 3D structure.
- Ligand 2D opens a compact ligand view when a ligand is detected.
- Ligand Interaction Diagram opens the detailed ligand interaction view.
- History lets you revisit recorded viewer actions.
- Fullscreen maximizes the scientific workspace for review or presentation.
When a trajectory is active, playback controls also appear at the bottom with play/pause, the frame slider, frame count, and speed.
A practical way to work
For a predictable review, move through the interface in this order:
Continue with a workflow
Your First Structure
Use the interface to complete a guided protein–ligand review.
Loading Data
Choose the correct path for a structure, MD trajectory, or docking result.
Representations & Colors
Build a clear and scientifically useful scene.
Molecular-Dynamics Trajectories
Load, validate, and explore a simulation.