Docking Analysis
Review ranked docking poses, search-site context, binding-mode clusters, interaction fingerprints, and the consensus pharmacophore.
Docking review has two connected levels. The Docking panel opens inside the Viewer for immediate pose inspection. Open full analysis then expands the workflow into the full analysis workspace for ranking, clustering, interaction, and pharmacophore comparisons.
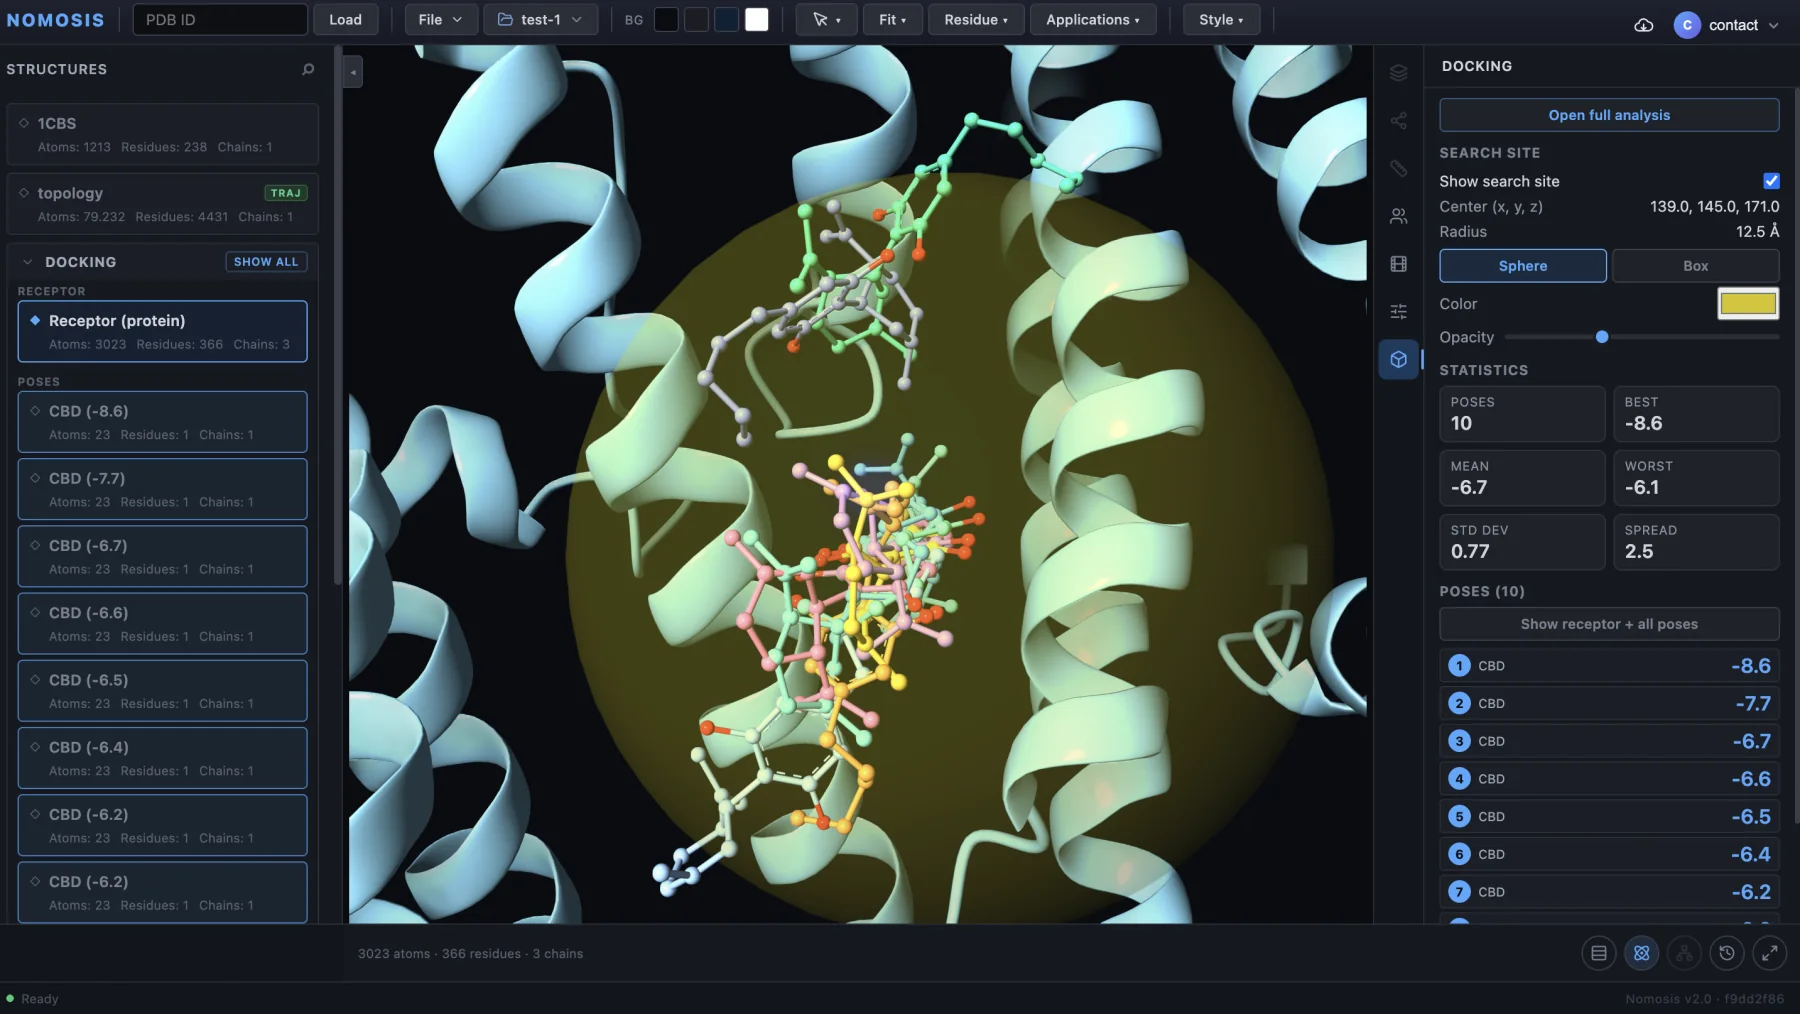
This is the initial Docking panel inside the Viewer. Use it to inspect the search site, summary statistics, and ranked poses before opening the full analysis workspace.
Two views, one active docking result
The panel shown above is the quick inspection view. Selecting Open full analysis opens the larger page shown in the remaining screenshots. Pose selection and the 3D molecular context stay connected between both views.
Start in the Docking panel
Confirm that the docking result is active and complete:
- A Receptor appears inside the Docking group under Structures.
- The expected number of ranked poses is present.
- The right-side Docking panel reports the program, score statistics, and search site when one is available.
- Fit → All (reset) frames the receptor and pose ensemble.
If the result is not loaded yet, follow Loading Data → Load docking results.
Use the quick inspection view
| Area | What it tells you | First check |
|---|---|---|
| Docking group on the left | Receptor, ranked poses, names, and scores | Expected pose count and rank order |
| 3D viewport | Pose location and orientation inside the receptor | Poses occupy the intended search site |
| Search site on the right | Center, size or radius, shape, color, and opacity | Site matches the docking setup |
| Statistics on the right | Pose count, best, mean, worst, standard deviation, and spread | Values are plausible for this run |
| Open full analysis | Opens the full-window analysis workspace | Correct docking result is active |
Use Show receptor + all poses for ensemble orientation. Select an individual ranked pose when you need an uncluttered view or want the analysis panels to follow a single hypothesis.
Scores are run-specific
The Best pose is determined from the ranking supplied by the docking result. The numeric direction depends on the scoring function: for example, a more negative affinity may be better in one workflow, while a higher fitness may be better in another.
Do not compare unlike scores
Compare scores only within compatible runs that use the same docking program, scoring function, receptor preparation, ligand preparation, and search-site definition. A score is a ranking aid, not experimental binding evidence.
Open the full analysis
The full analysis contains four complementary views: Overview, Clustering, Interactions, and Pharmacophore.
Recommended review order
Start with Overview, reduce redundant poses in Clustering, explain the remaining modes in Interactions, and use Pharmacophore to identify recurring features across the pose set.
Overview: establish the ranking
Use Overview to understand the run before narrowing it down. It summarizes:
- Best, mean, worst, and score variability.
- The number of poses with viewable 3D coordinates.
- The number of detected binding modes when clustering is available.
- A ranked pose table with score and available scoring terms.
- Score distribution and score-by-rank plots.
What to look for
- Confirm that rank 1 and its score match the right-side docking panel.
- Check whether several top-ranked poses have similar scores.
- Look for a clear score gap, but do not treat it as sufficient evidence by itself.
- Confirm that the poses you intend to compare have viewable 3D coordinates.
- Export the table only after confirming the active run and score units.
Clustering: identify binding modes
Docking runs often contain small variations of the same pose. Clustering groups structurally similar poses so you can compare distinct binding modes instead of reviewing every pose as if it were independent.
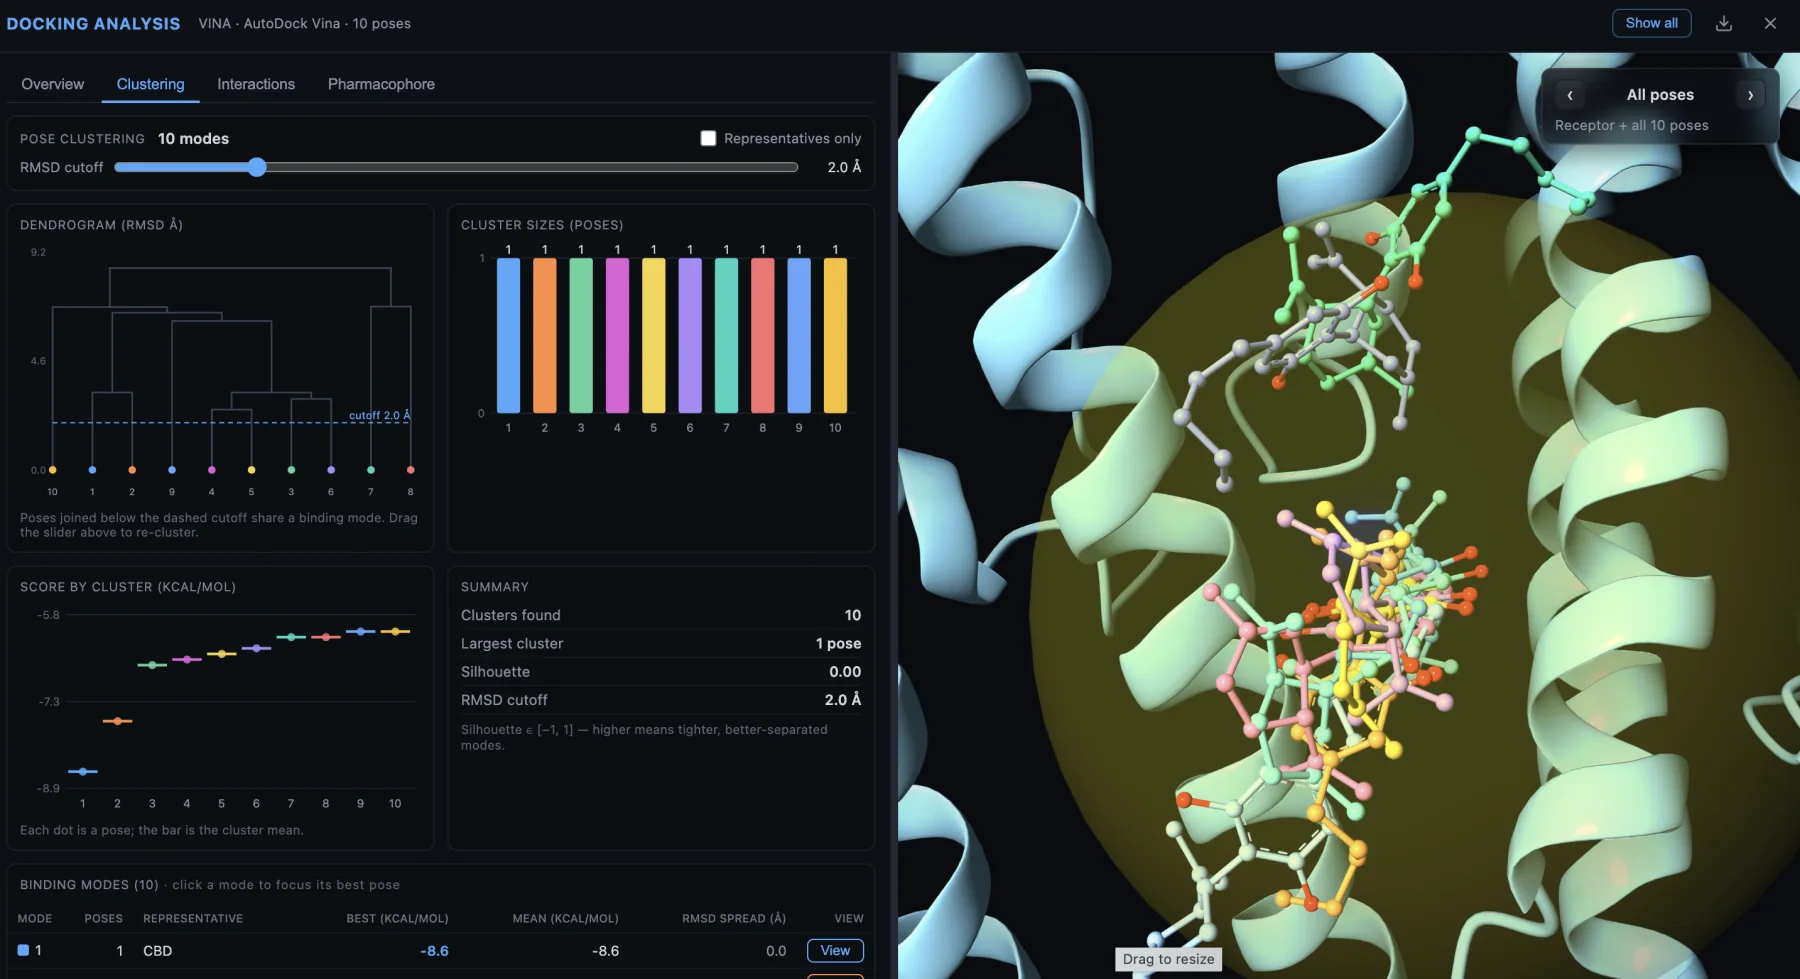
The RMSD cutoff controls how poses are grouped. The dendrogram and cluster summaries update as the cutoff changes, while the molecular scene preserves the structural context.
Use the clustering controls
| Control or view | How to read it |
|---|---|
| RMSD cutoff | Lower values separate poses more strictly; higher values merge broader pose families |
| Dendrogram | Poses joined below the dashed cutoff belong to the same binding mode |
| Cluster sizes | Shows whether a mode is repeatedly sampled or represented by only a few poses |
| Score by cluster | Compares the individual scores and mean score within each mode |
| Summary | Reports the number of modes, largest cluster, separation, and current cutoff |
| Binding modes table | Opens the best-ranked representative for each cluster |
| Representatives only | Removes redundant poses from the 3D view while retaining one representative per mode |
2.0 Å cutoff.A large cluster is not automatically the correct binding mode, and the best score is not automatically the most credible geometry. Use clustering to reduce redundancy, then evaluate contacts, strain, pocket fit, and experimental context.
Interactions: explain pose differences
The Interaction fingerprint is a pose-by-contact matrix. Each row represents one residue and interaction type; each column represents a pose. A filled cell means that the pose makes that contact.
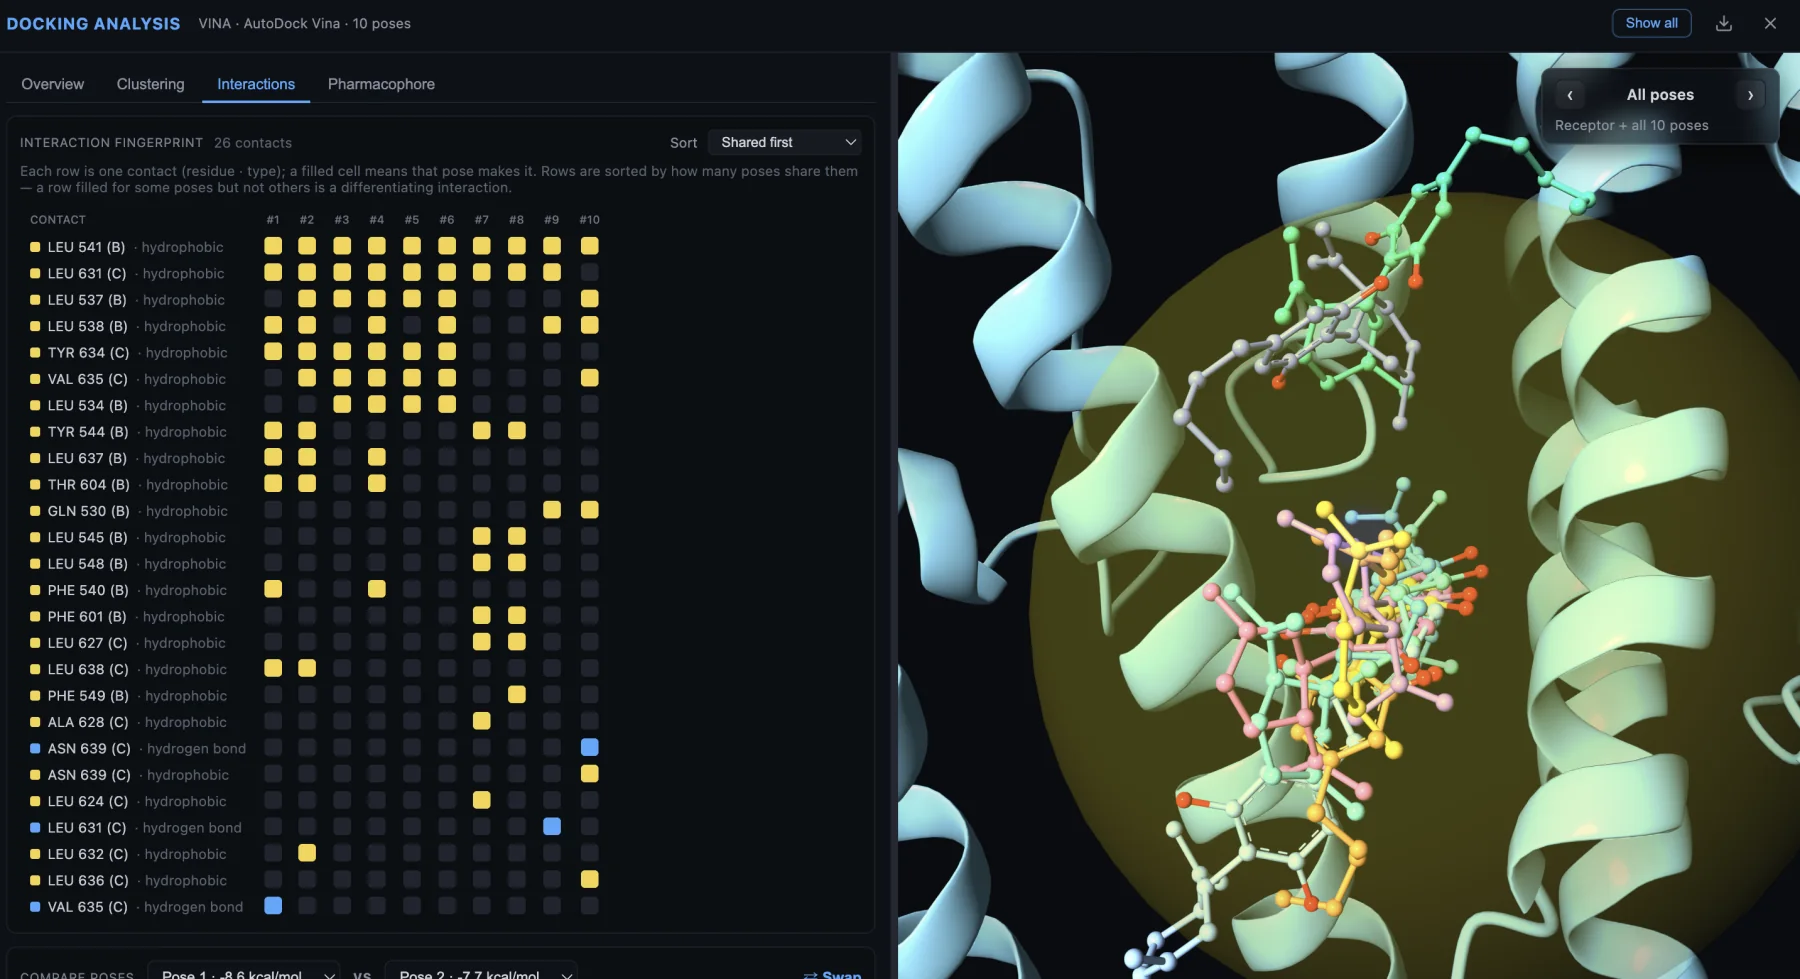
Rows shared across many columns describe conserved contacts. Partially filled rows distinguish poses and can help explain why similar geometries behave differently.
Read the fingerprint
- Start with Shared first to place conserved contacts at the top.
- Read the residue identifier and interaction type together; the residue alone is not the full fingerprint feature.
- Use rows filled across most poses to identify conserved anchors.
- Use partially filled rows to distinguish binding modes or pose families.
- Treat an empty cell as absence under the current geometric criteria, not proof that the contact can never form.
Compare two poses
Choose two poses under Compare poses. The comparison separates contacts into:
- Only in Pose 1 — contacts lost when moving to Pose 2.
- Shared — contacts preserved by both poses.
- Only in Pose 2 — contacts gained in Pose 2.
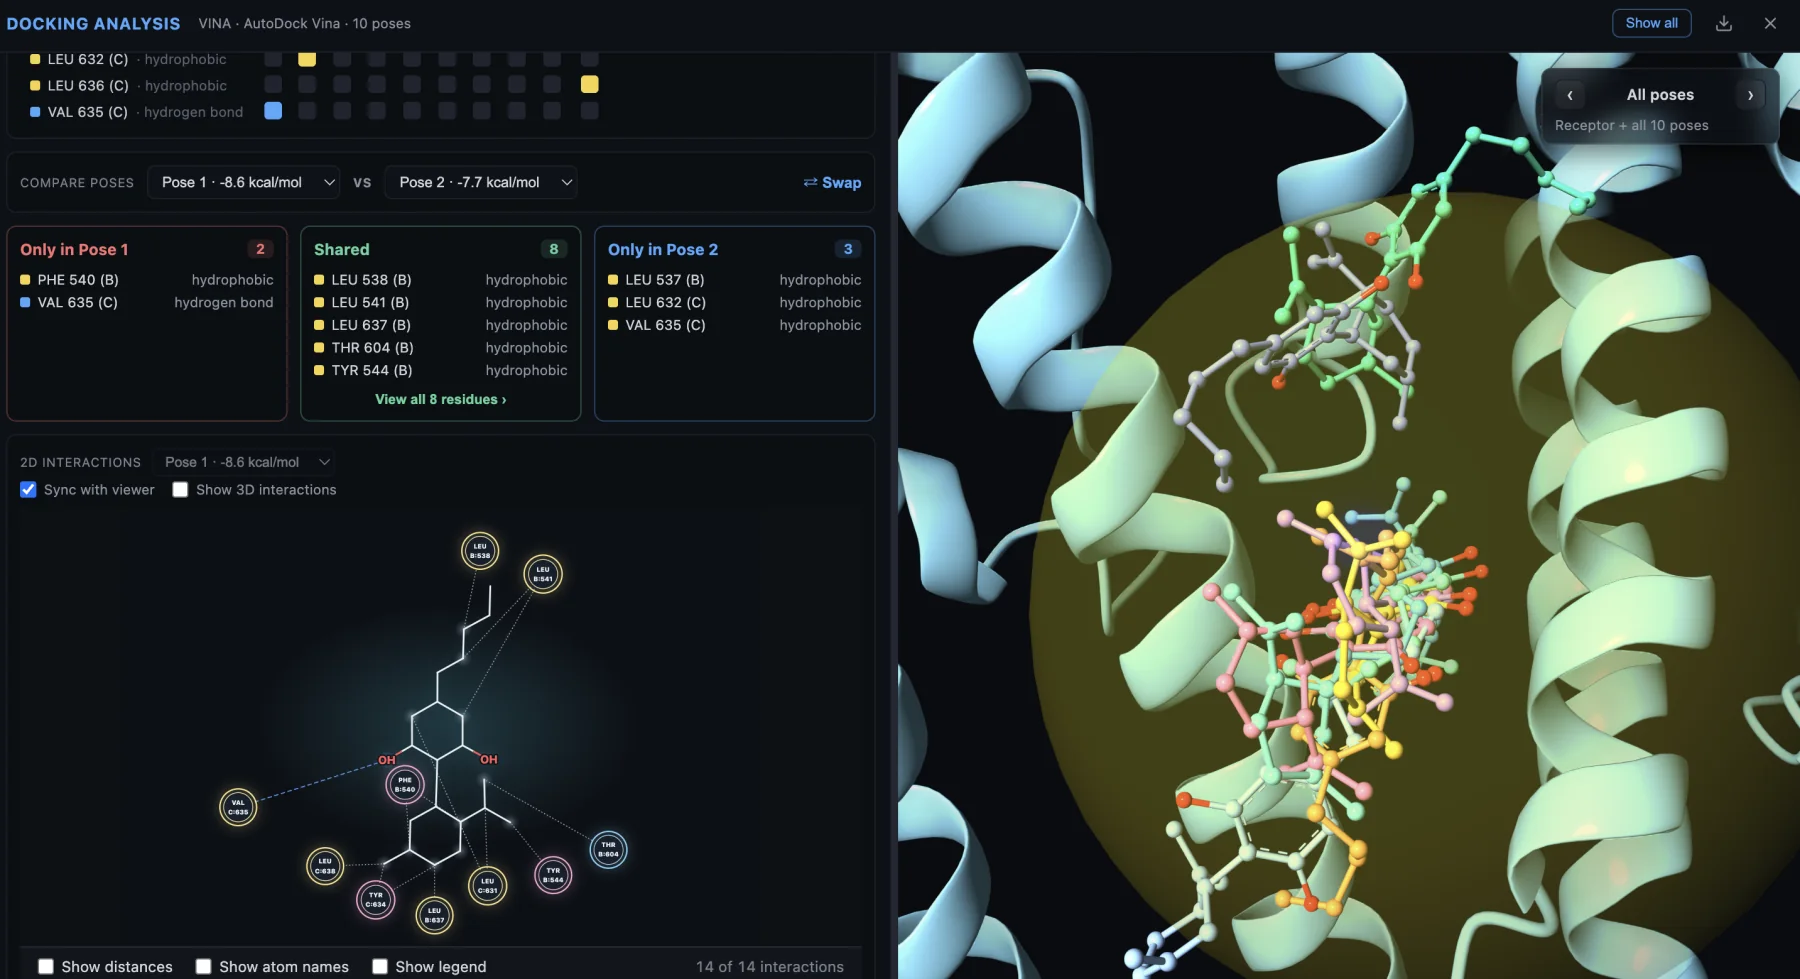
Pairwise comparison connects the lost, shared, and gained contact lists to a synchronized 2D diagram and the selected 3D pose.
Keep Sync with viewer enabled when you want the 2D diagram, pose selector, and 3D scene to refer to the same pose. Enable Show 3D interactions when spatial geometry is important; disable it when the additional lines obscure the ligand.
A strong comparison pair
Compare representatives from two different clusters, or compare the best-ranked pose with a lower-ranked pose that preserves a key experimental interaction. This produces a more useful contrast than comparing two nearly identical poses from the same mode.
Pharmacophore: find recurring requirements
The Pharmacophore tab builds a consensus from the interactions made by the loaded docking poses. It identifies recurring engaged features such as hydrogen-bond donors or acceptors, hydrophobic or aromatic features, and ionizable features, then shows how well each pose covers that consensus.
The view combines:
- A consensus hotspot table.
- A pose-by-hotspot matrix.
- Coverage and geometry-quality indicators per pose.
- A selected-pose comparison against the best-ranked pose.
- A 3D hotspot overlay connected to the active pose.
Interpret it correctly
- Satisfied means the pose places the corresponding engaged feature close to the consensus hotspot.
- Partial means the feature is present but geometrically less aligned.
- Not satisfied means that pose does not support the hotspot under the current criteria.
- A hotspot is marked required when it is supported by the best-ranked pose and by at least half of the analyzed poses.
Consensus from these poses
This model is derived from the imported pose ensemble and its receptor contacts. It is not an independent, pocket-intrinsic pharmacophore and should not be interpreted as one.
Use All poses to view the complete consensus model. Select an individual pose to show only the hotspots it engages and the feature-to-hotspot geometry for that pose.